Table of Contents
Environmental sustainability is no longer an optional accolade for global consumer brands; it has become a strict regulatory and commercial baseline. As global supply chains navigate the transition toward a circular economy, evaluating packaging materials is no longer just about whether an item can be recycled. Instead, it has evolved into a multi-dimensional assessment of life-cycle carbon emissions, regulatory compliance costs, and consumer perceptions.
The European Commission’s Joint Research Centre (JRC) recently published its updated packaging model (Version 2.0). Utilizing actual consumer sales data across 19 EU Member States representing over 97% of the EU population, this report maps the quantities of packaging placed on the market from 2011 to 2025. For brands exporting to Europe, e-commerce retailers, and sustainable vloggers, this data provides the scientific foundation needed to dismantle common misconceptions about packaging sustainability and adapt to upcoming regulatory shifts.
The JRC’s Version 2.0 methodology expanded its scope beyond food and beverages to include home care, beauty and personal care, and pet food. Together, these sectors account for roughly 75% of the total European consumer packaging market.
The Heavyweight Dominance of Glass: Mapping the Environmental Mass
The JRC’s Version 2.0 methodology expanded its scope beyond food and beverages to include home care, beauty and personal care, and pet food. Together, these sectors account for roughly 75% of the total European consumer packaging market.
The Physical Mass King: Glass at 75.5% of Total Weight
According to the JRC model, a total of 42.8 million tonnes of consumer packaging was placed on the studied EU markets in 2024, equating to approximately 98 kg per capita. Glass packaging overwhelmingly dominated this figure in terms of physical mass:
- The Massive Tonnage: Out of the 42.8 million tonnes of packaging, glass accounted for 32.3 million tonnes—representing a staggering 75.5% of the total physical mass.
- F&B as the Heavyweight Driver: Food and beverage packaging dominated consumer packaging flows, making up 97% of the total weight. Within this, alcoholic beverages (beer, wine, and spirits) generated the highest glass footprint, contributing 22.8 million tonnes in 2024.
- Single Largest Category: Reusable and single-use beer bottles emerged as the single largest packaging category across all material types, contributing approximately 16.5 million tonnes to the total mass—even surpassing the collective weight of all plastics.
The Subtle Expansion of Plastics
While glass represents the heaviest share of the waste stream, plastic packaging showed a distinct, uninterrupted upward trajectory. It was the only packaging material category to experience absolute growth over the 2011–2025 study period, rising by 11% to reach 5.9 million tonnes (averaging 14 kg per person annually). Polyethylene terephthalate (PET) remains the dominant polymer for mineral water and soft drinks, though polypropylene (PP) commands a higher market share in countries like Sweden and the Netherlands due to its widespread use in food tubs and dairy packaging.
Below is a detailed breakdown of the 2024 EU-19 consumer packaging market based on JRC 2.0 data:
| Packaging Material | 2024 Market Volume (Million Tonnes) | Share of Total Weight (%) | Key Product Applications | 15-Year Growth Trend |
|---|---|---|---|---|
| Glass | 32.3 | ~75.5% | Beer, wine, spirits, sauces, premium cosmetics, fragrance flacons | Fluctuated; dipped in 2020 before recovering |
| Plastics | 5.9 | ~13.8% | Water/soft drink bottles, dairy, home/personal care products | Consistent upward trend (+11% absolute growth) |
| Metals | 2.3 | ~5.4% | Cans, food tins, aerosol containers | Relatively stable with minor fluctuations |
| Paper & Cardboard | 2.1 | ~4.9% | Liquid packaging cartons, paper bags, secondary wrapping | Steady, with minor increases in specific sectors |
| Composites/Mixed | 0.1 | ~0.4% | Multi-layer barrier pouches, specialized valves | Highly stable and niche |
Regional Nuances and the Myth of Material Substitution
A crucial finding of the JRC report is that there is no singular, uniform direction for packaging material trends in Europe. Consumer behaviors and regional infrastructure drive vastly different outcomes.
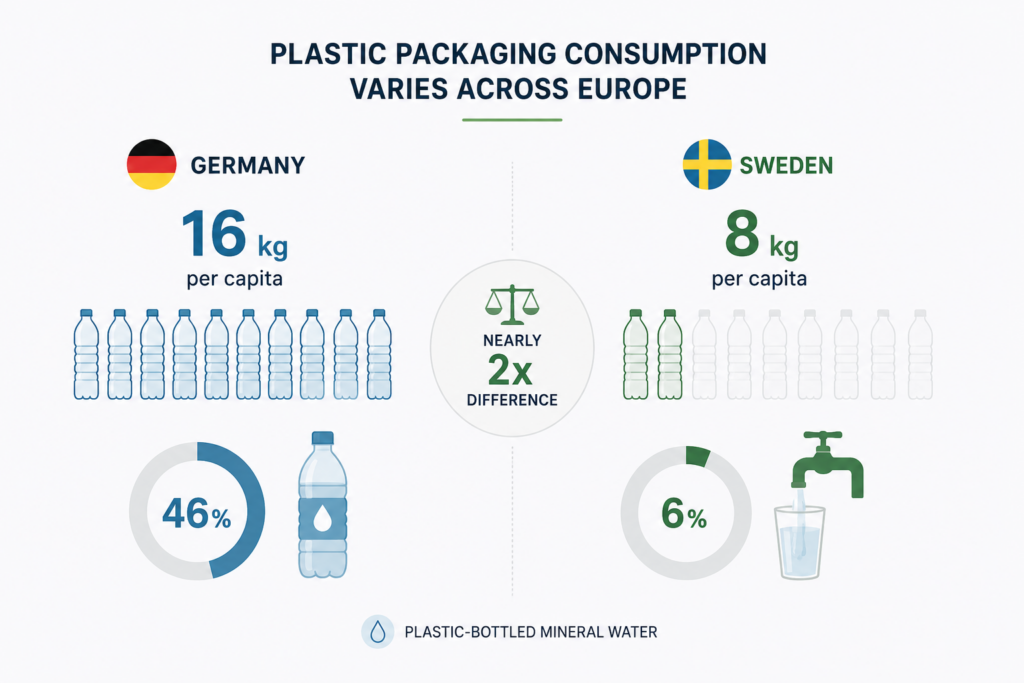
Plastic packaging consumption varies nearly twofold across the EU, with Germany registering 16 kg per capita compared to Sweden’s 8 kg. This disparity is heavily linked to regional beverage cultures. For instance, plastic-bottled mineral water accounts for 46% of all plastic packaging used in Italy, but represents just 6% of plastic packaging in Sweden, where tap water consumption is the norm.
The True Drivers of Material Shifting
The JRC investigated packaging substitution trends from 2011 to 2025 across four major products: milk, bottled water, juice, and carbonated soft drinks. Out of thousands of possible combinations, the researchers identified only seven cases where market share shifted by more than 15 percentage points. These cases revealed two key insights:
“Re-Glassification” is Regional: While France saw milk packaging shift from cartons and high-density polyethylene (HDPE) to PET (+23 percentage points), Bulgaria saw its bottled water market undergo “re-glassification,” where PET fell by 17 percentage points and glass gained 17 percentage points.
Premiumisation Over Eco-Redesign: Many visible shifts in material packaging were actually driven by changes in the broader consumer product mix (such as the rising popularity of premium spirits or craft beverages) rather than manufacturers proactively substituting materials for environmental reasons.
Environmental Perceptions: Consumer Sentiment vs. LCA Realities
A major friction point exists between consumer sentiment and scientific Life Cycle Assessments (LCAs).
The Consumer Angle: Unshakable Trust in Glass
Surveys commissioned by the European Container Glass Federation (FEVE) reveal that glass is overwhelmingly viewed as the most sustainable packaging option.
- The Infinite Circular Loop: 76% of European consumers recognize that glass is 100% infinitely recyclable without losing its purity or quality.
- Health and Safety: Consumers heavily favor glass for cosmetics, perfumery, and pharmaceuticals (flaconnage). Over 75% of Europeans prefer glass flacons, citing its chemical inertness, which prevents harmful chemicals (such as BPA or plastic additives) from leaching into the formulation and preserves the natural scent and quality of the product.
- Brand Perception: 92% of consumers state they feel more positively toward a company that offers its products in glass packaging because of its lower environmental impact compared to plastics.
The LCA Catch: The Carbon and Weight Penalty
Despite its stellar reputation, single-use glass packaging frequently performs poorly in standard cradle-to-grave LCAs compared to lightweight plastics:
- High Thermal Energy Demand: While PET plastic can be melted and molded at roughly 200°C, raw glass manufacturing requires heating silica sand, soda ash, and limestone to extreme temperatures of around 1600°C, consuming massive amounts of energy.
- The Logistic Weight Penalty: A standard glass bottle can weigh up to 40 times more than a comparable PET container. This excess physical weight requires significantly more fuel to transport, multiplying Scope 3 transport emissions across the entire supply chain.
- The Carbon Comparison: If all plastic bottles used globally were replaced with single-use glass bottles, the additional carbon footprint would be equivalent to powering 22 large coal-fired power plants.
However, standard LCAs have a major limitation: they rarely calculate the environmental damage caused by end-of-life plastic leakage, such as marine plastic litter, microplastic accumulation in food chains, and toxic chemical leaching. When these factors are considered, the long-term ecological benefits of glass become much more pronounced.
Minimizing Environmental Footprints: Reusability and Decarbonization Milestones
To maintain its competitive edge against lightweight materials under future sustainability frameworks, the glass industry is pursuing dual strategies: optimizing logistics through reusability and decarbonizing the manufacturing process.
Operational Decarbonization and Green Supply Chain
Valiant does not just preach sustainability; it actively integrates green initiatives into its own manufacturing DNA. As an ISO 14001 certified organization, Valiant operates state-of-the-art dual-fuel furnaces equipped with electric boosting, using clean natural gas over 90% of the time to limit sulfur emissions.
To further reduce its manufacturing carbon footprint, Valiant has successfully installed 5 MW of solar rooftop systems across its facilities, alongside a massive 8.4 MW wind-power system in China. These investments in renewable power help Valiant rationalize energy costs while producing carbon-conscious glass packaging that aligns perfectly with Europe’s transition to net-zero.
By optimizing post-consumer recycled (PCR) glass cullet intake and engineering durable, aesthetically flawless containers designed to stand out on the shelves, Valiant Glass proves that premium branding and environmental compliance are not mutually exclusive. For brands looking to conquer the European market under the new PPWR framework, partnering with Valiant Glass is the ultimate step toward a sustainable, high-value future.